Back in 2014, M12 Solutions scored a positive Net Promoter Score of +41, so two years later it was time to conduct the powerful customer survey again to monitor M12 Solutions’ business performance.
Net Promoter has been positioned as today’s standard for measuring customer loyalty. It has been identified the most effective tool for accurately measuring customer satisfaction and links that metric to long-term financial growth. It also helps employees to understand how they engage with their customers and it opens the door to change and improve business performance.
How it works:
Net promoter divides our customers into three groups- Promoters, Passives and Detractors:
- Promoters (score 9-10) are loyal enthusiasts who will keep buying and refer others, fuelling growth.
- Passives (score 7-8) are satisfied but unenthusiastic customers who are vulnerable to competitive offerings.
- Detractors (score 0-6) are unhappy customers who can damage your brand and impede growth through negative word-of-mouth.
A company seeking growth must increase the percentage of Promoters and decrease the percentage of Detractors.
I called all of our M12 Solutions customers and managed to speak to most. I asked three very straight forward questions:
- On a scale of 1 – 10, how likely is it that you would recommend M12 Solutions to a friend or colleague?
- Can I ask why you gave us that score?
- Is there anything you think we can improve on?
Customers respond on a 1 to 10 point scale rating and categorizes our customers into the three groups. The Net Promoter system only requires the first question however I took the opportunity to ask the second and third question to gain an understanding of their reasoning behind the score which allowed us to identify anything we can improve on and what we’re doing well. So after each round of calls I then passed around the company all the scores and feedback we were given.

The way we calculate our Net Promoter Score is to take the percentage of our customers who are Promoters and subtract the percentage who are Detractors.
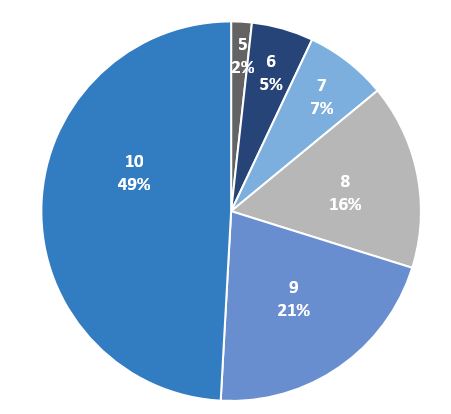
Below is a pie chart showing how our customers scored us:
pie chart
We are delighted to announce we received a fantastic Net Promoter Score of +63! An amazing improvement to our 2014 NPS of +41.
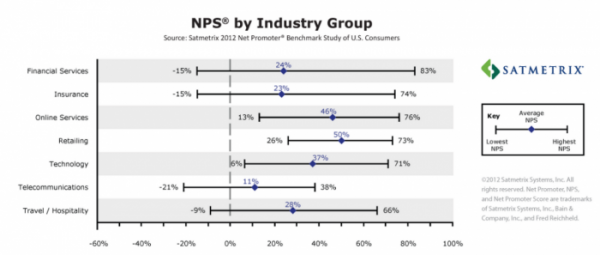
So what does this score mean? Well, as you can see from the table below, the Telecommunications industry average Net Promoter score is 11, with the highest score recorded being 38! You can also see the average scores across other industries:

Net Promoter really gives us an insight of how our customers view our service and we can understand what we’re doing well and what we can do to improve in future. It was lovely to hear the really positive feedback.
For M12 Solutions, Managing Director, Andrew Skipsey says, “2 years ago we wanted to know what our customer service start point was and we scored a very creditable +41. Then in January 2015 at our away day our people confirmed our business-wide ambition to serve customers such that we would secure our industry’s highest Net Promoter Score. To me it’s not great initiatives which make a difference, it’s every day customer contacts which if done quickly, courteously and professionally secure customers feeling of receiving great service. For M12 it’s a longer term score and to receive so many 9’s and 10’s is incredible. I know when I get asked I’m an 8 sort of person for everyday good service so I know that to get high scores is a big deal. We’ve improved our openness, our supplier liaisons and generally taken past feedback on-board to improve. It’s an ongoing process there is no such thing as treading water in business and particularly in our dynamic sector.”
Thank you to all of our customers who took part in our survey.
